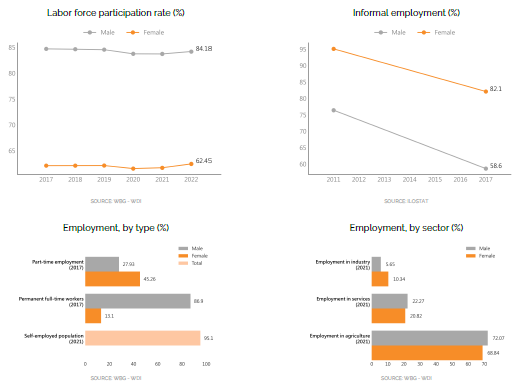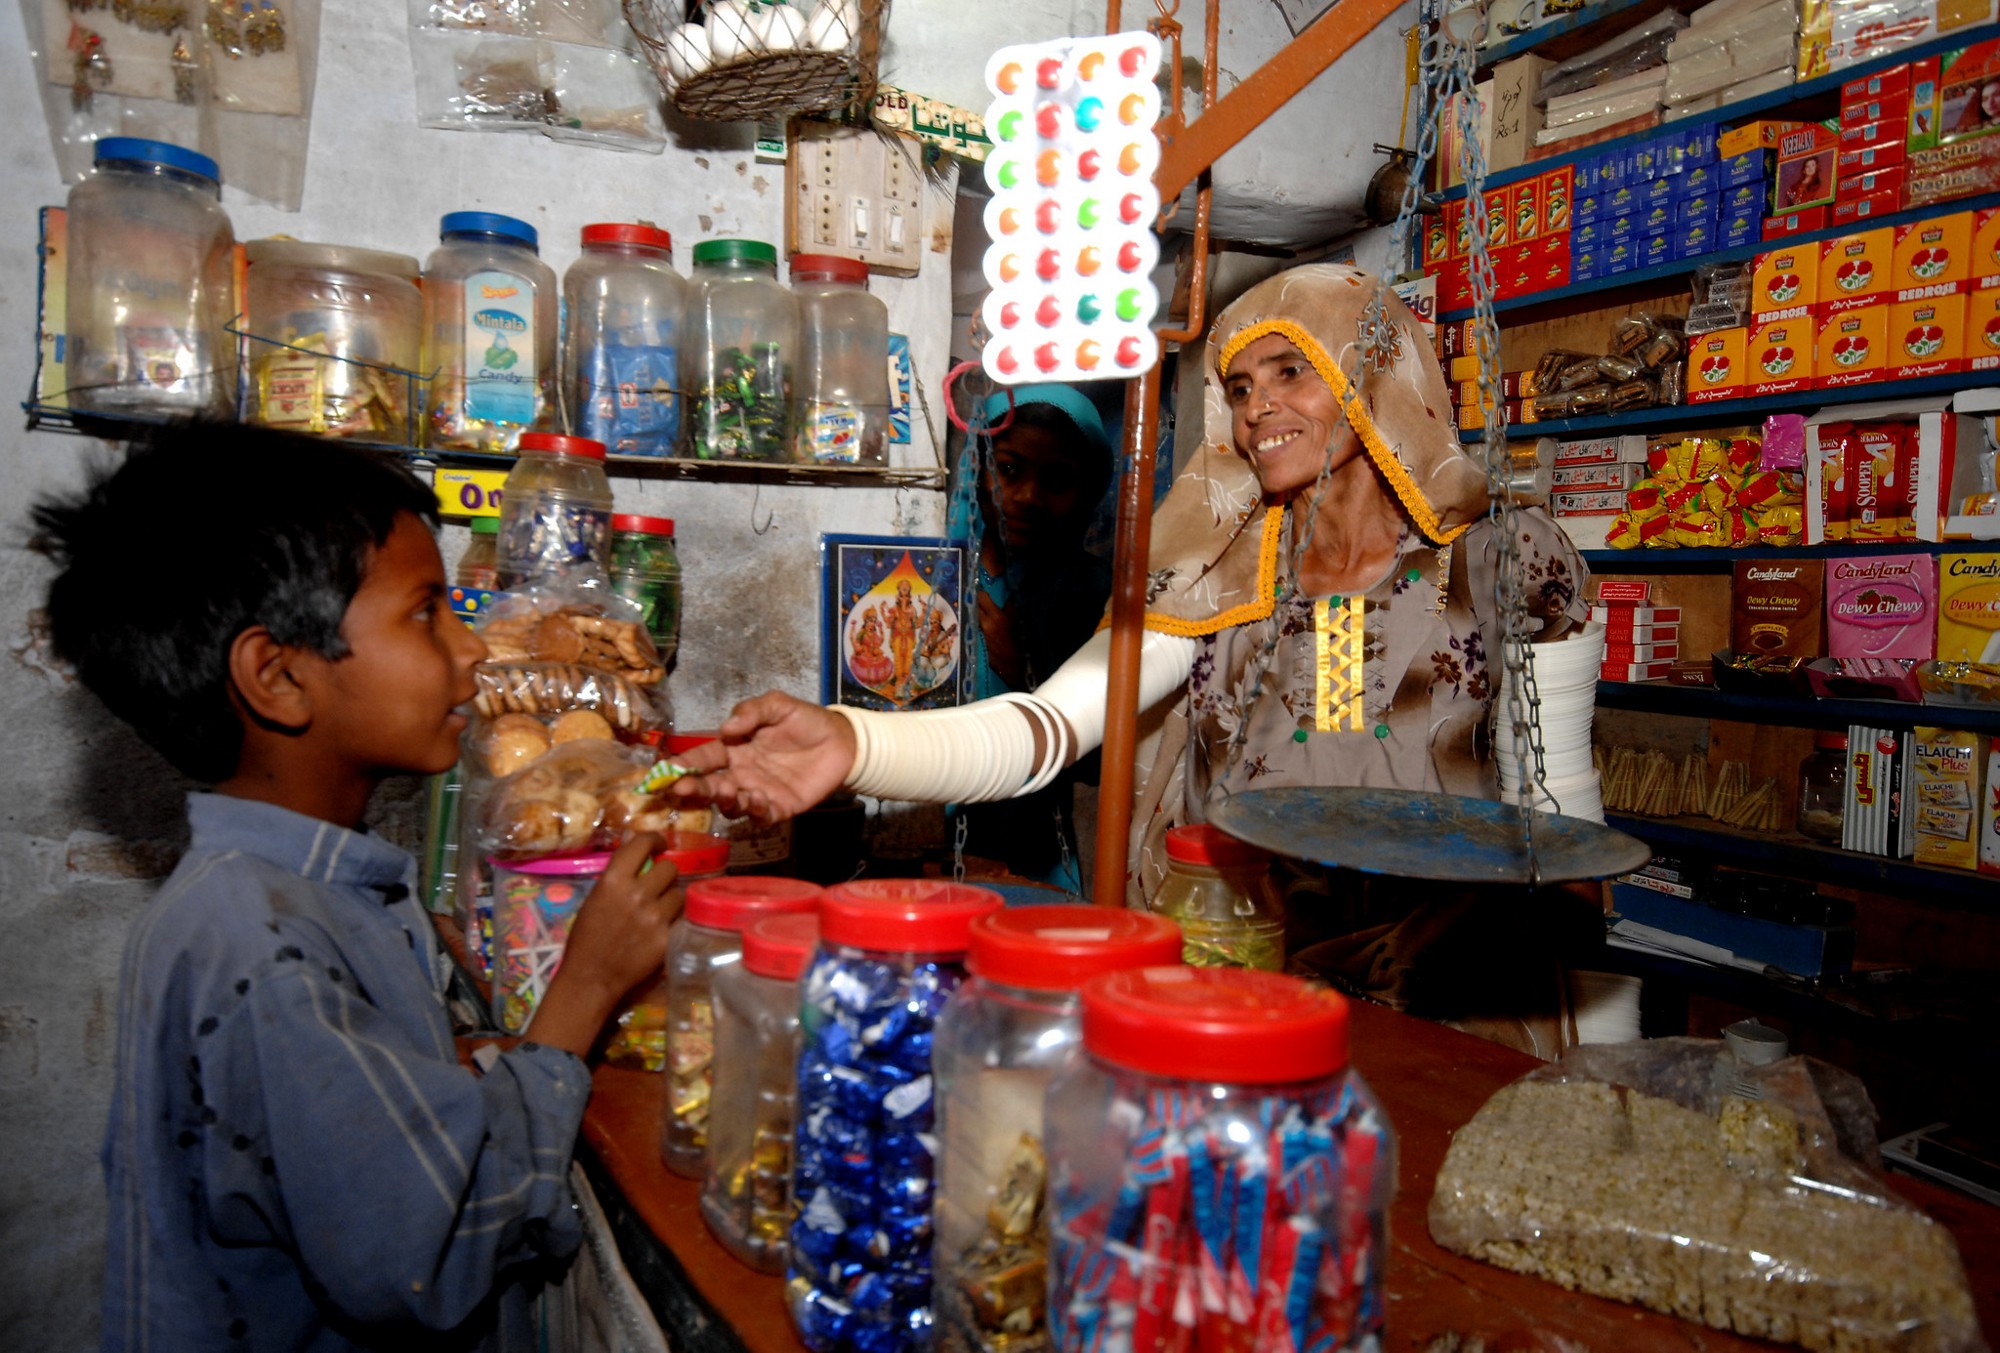
These figures, of course, do not represent just one woman. Rather, they reflect the average of an entire nation. While in most countries the situation is not quite so dire for women, full gender parity still does not exist in any nation. Scaled up to a global level, that amounts to a lot of gender inequality – gender gaps are a global phenomenon. And in the most extreme cases, grave gender discrimination is associated with a host of societal ills including war, displacement, environmental degradation and the spread of disease, impacting us all.
Each country’s particular circumstances and level of inequality are different. Data help us realize both these things – inequality is pervasive across all societies but the degree and extent of it differs from country to country. This means that each country's solution needs to be tailored to its context. The right combination of data and a structured way of interpreting it can help us figure out the design of the right policy or program solutions.
A healthy, inclusive economy is based on various factors, and promoting economic participation and growth may require looking at a multitude of data, covering several sectors. Synthesizing data in such a way is not a common skill. Particularly when you are considering the constraints and challenges women face, it means bringing into your work measures not normally used in economic analysis, such as the availability of contraceptives or the prevalence of child marriage. Further, you have to learn to read across categories of information to discern the constraints being applied to women that do not affect men. Then, and only then, can you formulate policy solutions with real integrity.


